

Industrial cleaning equipment manufacturer Tennant Company missed Wall Street’s revenue expectations in Q2 CY2025, with sales falling 3.7% year on year to $318.6 million. The company’s full-year revenue guidance of $1.23 billion at the midpoint came in 1.5% below analysts’ estimates. Its non-GAAP profit of $1.49 per share was 8.6% below analysts’ consensus estimates.
Is now the time to buy Tennant? Find out by accessing our full research report, it’s free.
Tennant (TNC) Q2 CY2025 Highlights:
- Revenue: $318.6 million vs analyst estimates of $327.2 million (3.7% year-on-year decline, 2.6% miss)
- Adjusted EPS: $1.49 vs analyst expectations of $1.63 (8.6% miss)
- Adjusted EBITDA: $51 million vs analyst estimates of $53.5 million (16% margin, 4.7% miss)
- The company reconfirmed its revenue guidance for the full year of $1.23 billion at the midpoint
- Management reiterated its full-year Adjusted EPS guidance of $5.95 at the midpoint
- EBITDA guidance for the full year is $202.5 million at the midpoint, above analyst estimates of $195.7 million
- Operating Margin: 9.6%, down from 11.8% in the same quarter last year
- Free Cash Flow Margin: 5.9%, up from 4.3% in the same quarter last year
- Market Capitalization: $1.54 billion
"Tennant delivered solid second quarter results that keep us on track to achieve our full-year guidance," said Dave Huml, Tennant President and Chief Executive Officer.
Company Overview
As the world’s largest manufacturer of autonomous mobile robots, Tennant (NYSE:TNC) designs, manufactures, and sells cleaning products to various sectors.
Revenue Growth
A company’s long-term sales performance is one signal of its overall quality. Any business can have short-term success, but a top-tier one grows for years. Regrettably, Tennant’s sales grew at a sluggish 3.8% compounded annual growth rate over the last five years. This fell short of our benchmark for the industrials sector and is a poor baseline for our analysis.
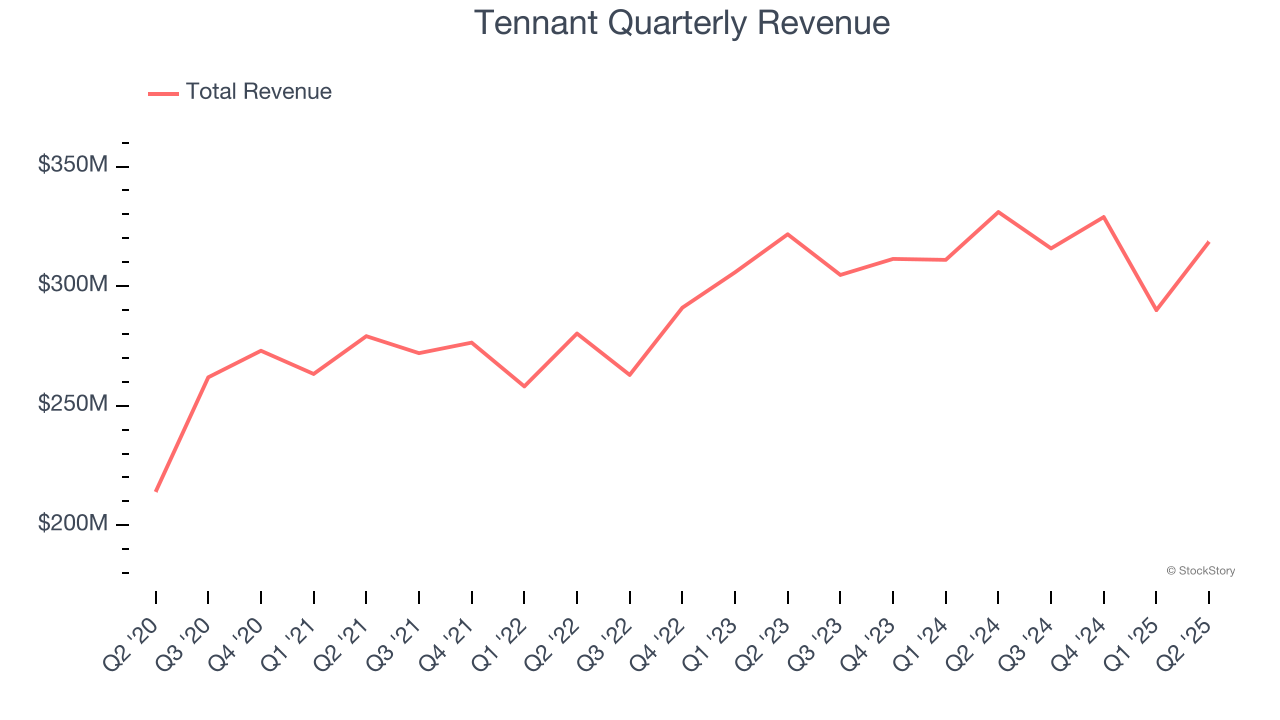
We at StockStory place the most emphasis on long-term growth, but within industrials, a half-decade historical view may miss cycles, industry trends, or a company capitalizing on catalysts such as a new contract win or a successful product line. Tennant’s annualized revenue growth of 3% over the last two years aligns with its five-year trend, suggesting its demand was consistently weak. 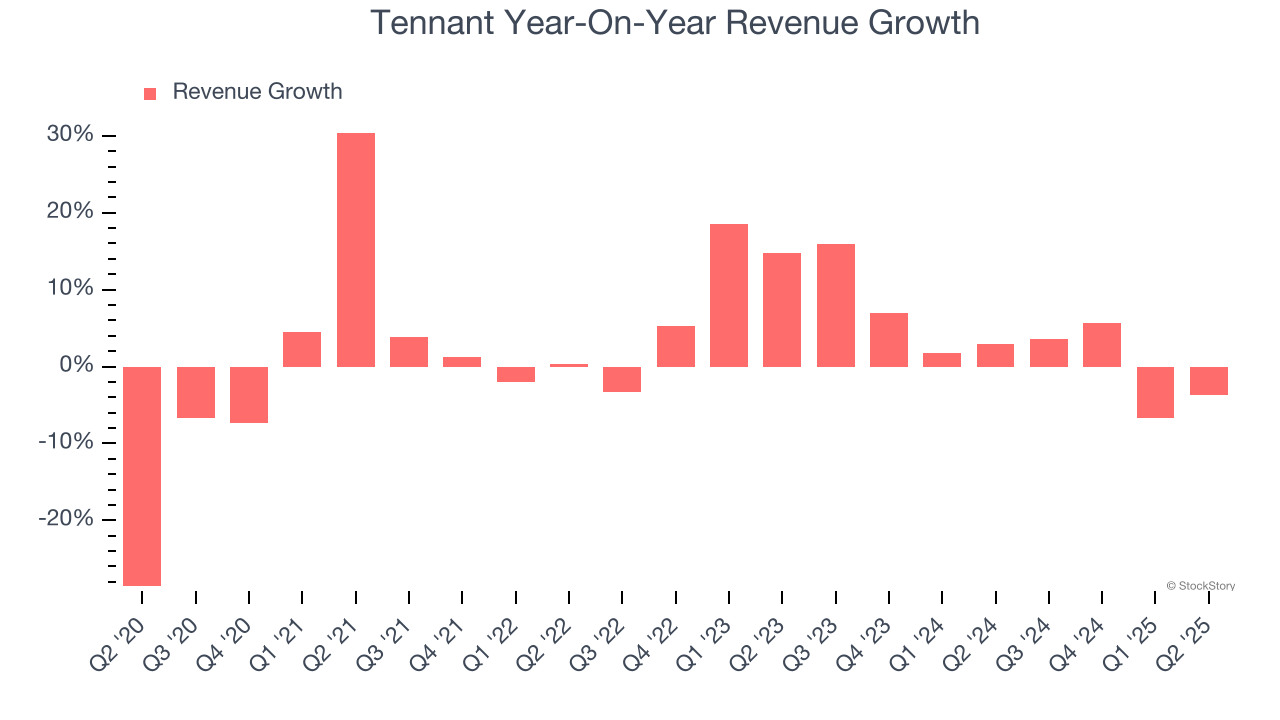
This quarter, Tennant missed Wall Street’s estimates and reported a rather uninspiring 3.7% year-on-year revenue decline, generating $318.6 million of revenue.
Looking ahead, sell-side analysts expect revenue to grow 1.5% over the next 12 months, similar to its two-year rate. This projection doesn't excite us and implies its products and services will see some demand headwinds.
Today’s young investors won’t have read the timeless lessons in Gorilla Game: Picking Winners In High Technology because it was written more than 20 years ago when Microsoft and Apple were first establishing their supremacy. But if we apply the same principles, then enterprise software stocks leveraging their own generative AI capabilities may well be the Gorillas of the future. So, in that spirit, we are excited to present our Special Free Report on a profitable, fast-growing enterprise software stock that is already riding the automation wave and looking to catch the generative AI next.
Operating Margin
Tennant’s operating margin might fluctuated slightly over the last 12 months but has remained more or less the same, averaging 9% over the last five years. This profitability was higher than the broader industrials sector, showing it did a decent job managing its expenses.
Analyzing the trend in its profitability, Tennant’s operating margin might fluctuated slightly but has generally stayed the same over the last five years. This raises questions about the company’s expense base because its revenue growth should have given it leverage on its fixed costs, resulting in better economies of scale and profitability.
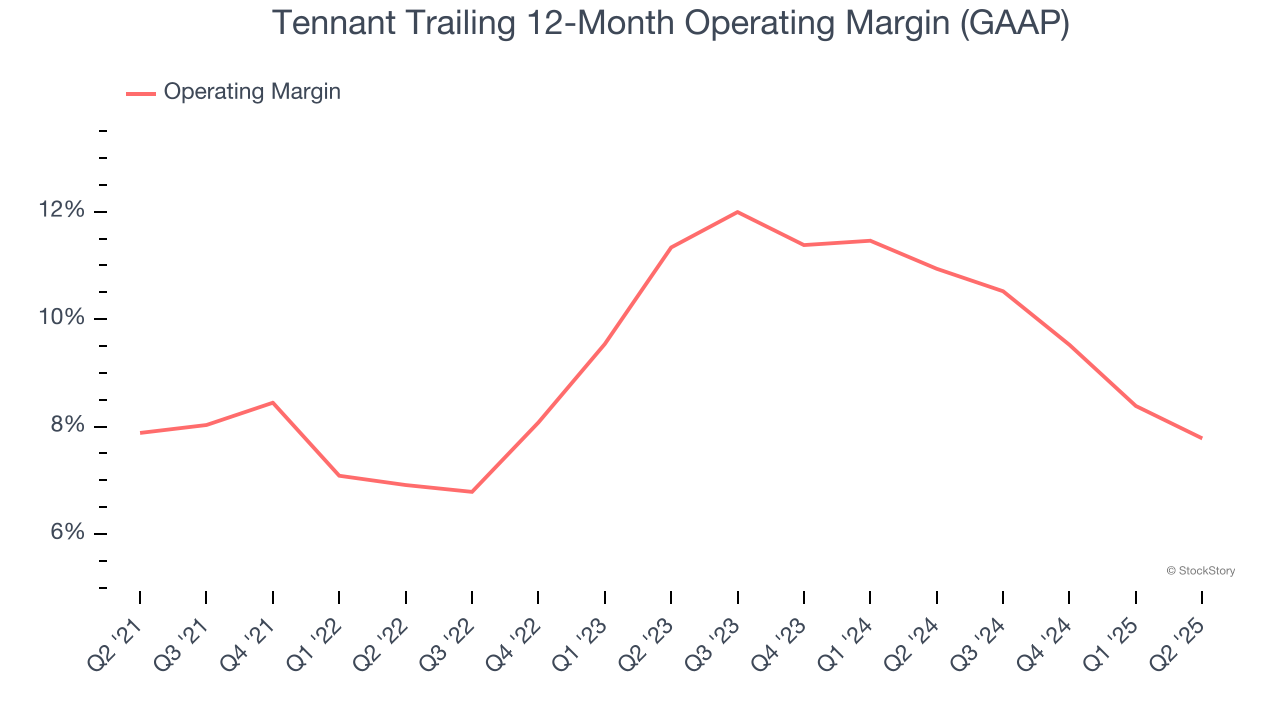
In Q2, Tennant generated an operating margin profit margin of 9.6%, down 2.2 percentage points year on year. Since Tennant’s operating margin decreased more than its gross margin, we can assume it was less efficient because expenses such as marketing, R&D, and administrative overhead increased.
Earnings Per Share
We track the long-term change in earnings per share (EPS) for the same reason as long-term revenue growth. Compared to revenue, however, EPS highlights whether a company’s growth is profitable.
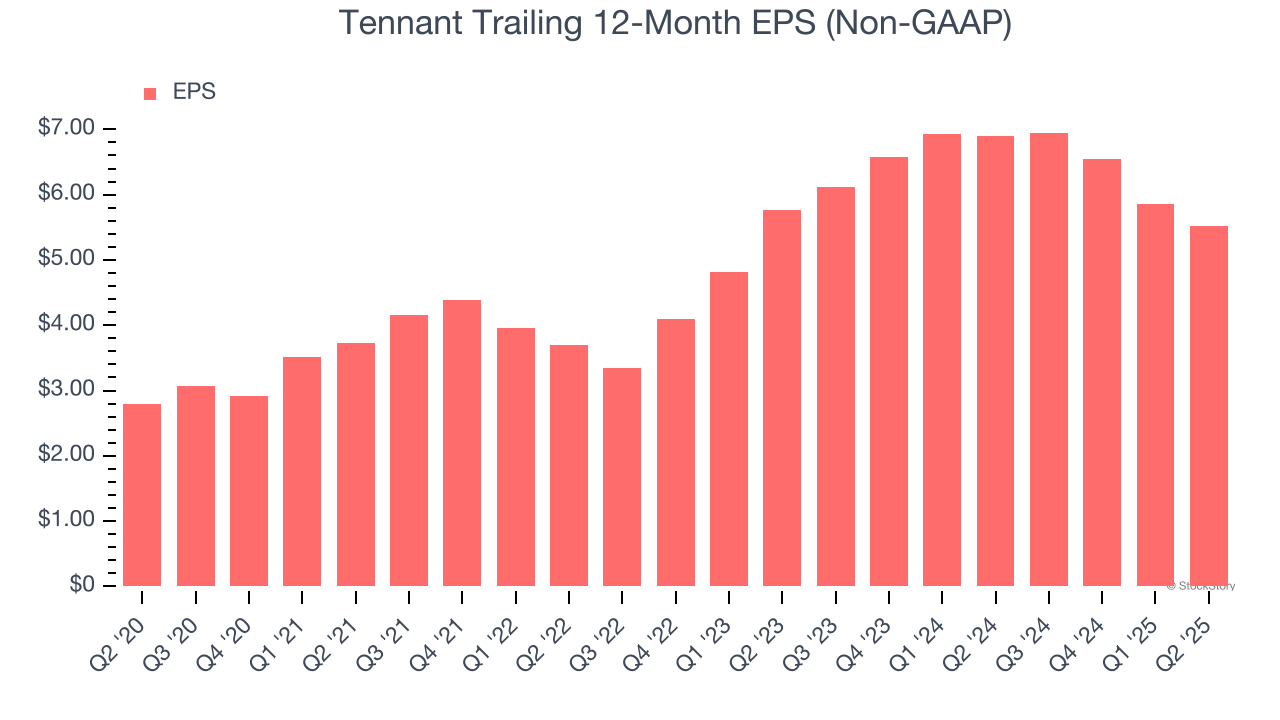
Tennant’s EPS grew at a remarkable 14.5% compounded annual growth rate over the last five years, higher than its 3.8% annualized revenue growth. However, we take this with a grain of salt because its operating margin didn’t improve and it didn’t repurchase its shares, meaning the delta came from reduced interest expenses or taxes.
Like with revenue, we analyze EPS over a shorter period to see if we are missing a change in the business.
Tennant’s two-year annual EPS declines of 2.1% were bad and lower than its 3% two-year revenue growth.
Diving into the nuances of Tennant’s earnings can give us a better understanding of its performance. Tennant’s operating margin has declined by 4.3 percentage points over the last two years. This was the most relevant factor (aside from the revenue impact) behind its lower earnings; interest expenses and taxes can also affect EPS but don’t tell us as much about a company’s fundamentals.
In Q2, Tennant reported adjusted EPS at $1.49, down from $1.83 in the same quarter last year. This print missed analysts’ estimates, but we care more about long-term adjusted EPS growth than short-term movements. Over the next 12 months, Wall Street expects Tennant’s full-year EPS of $5.52 to grow 11.1%.
Key Takeaways from Tennant’s Q2 Results
We were impressed by Tennant’s optimistic full-year EBITDA guidance, which blew past analysts’ expectations. On the other hand, its revenue missed and its EPS fell short of Wall Street’s estimates. Overall, this quarter could have been better. The stock remained flat at $82.59 immediately after reporting.
So should you invest in Tennant right now? If you’re making that decision, you should consider the bigger picture of valuation, business qualities, as well as the latest earnings. We cover that in our actionable full research report which you can read here, it’s free.